项目中用SVG画曲线和动画的一次记录
背景介绍
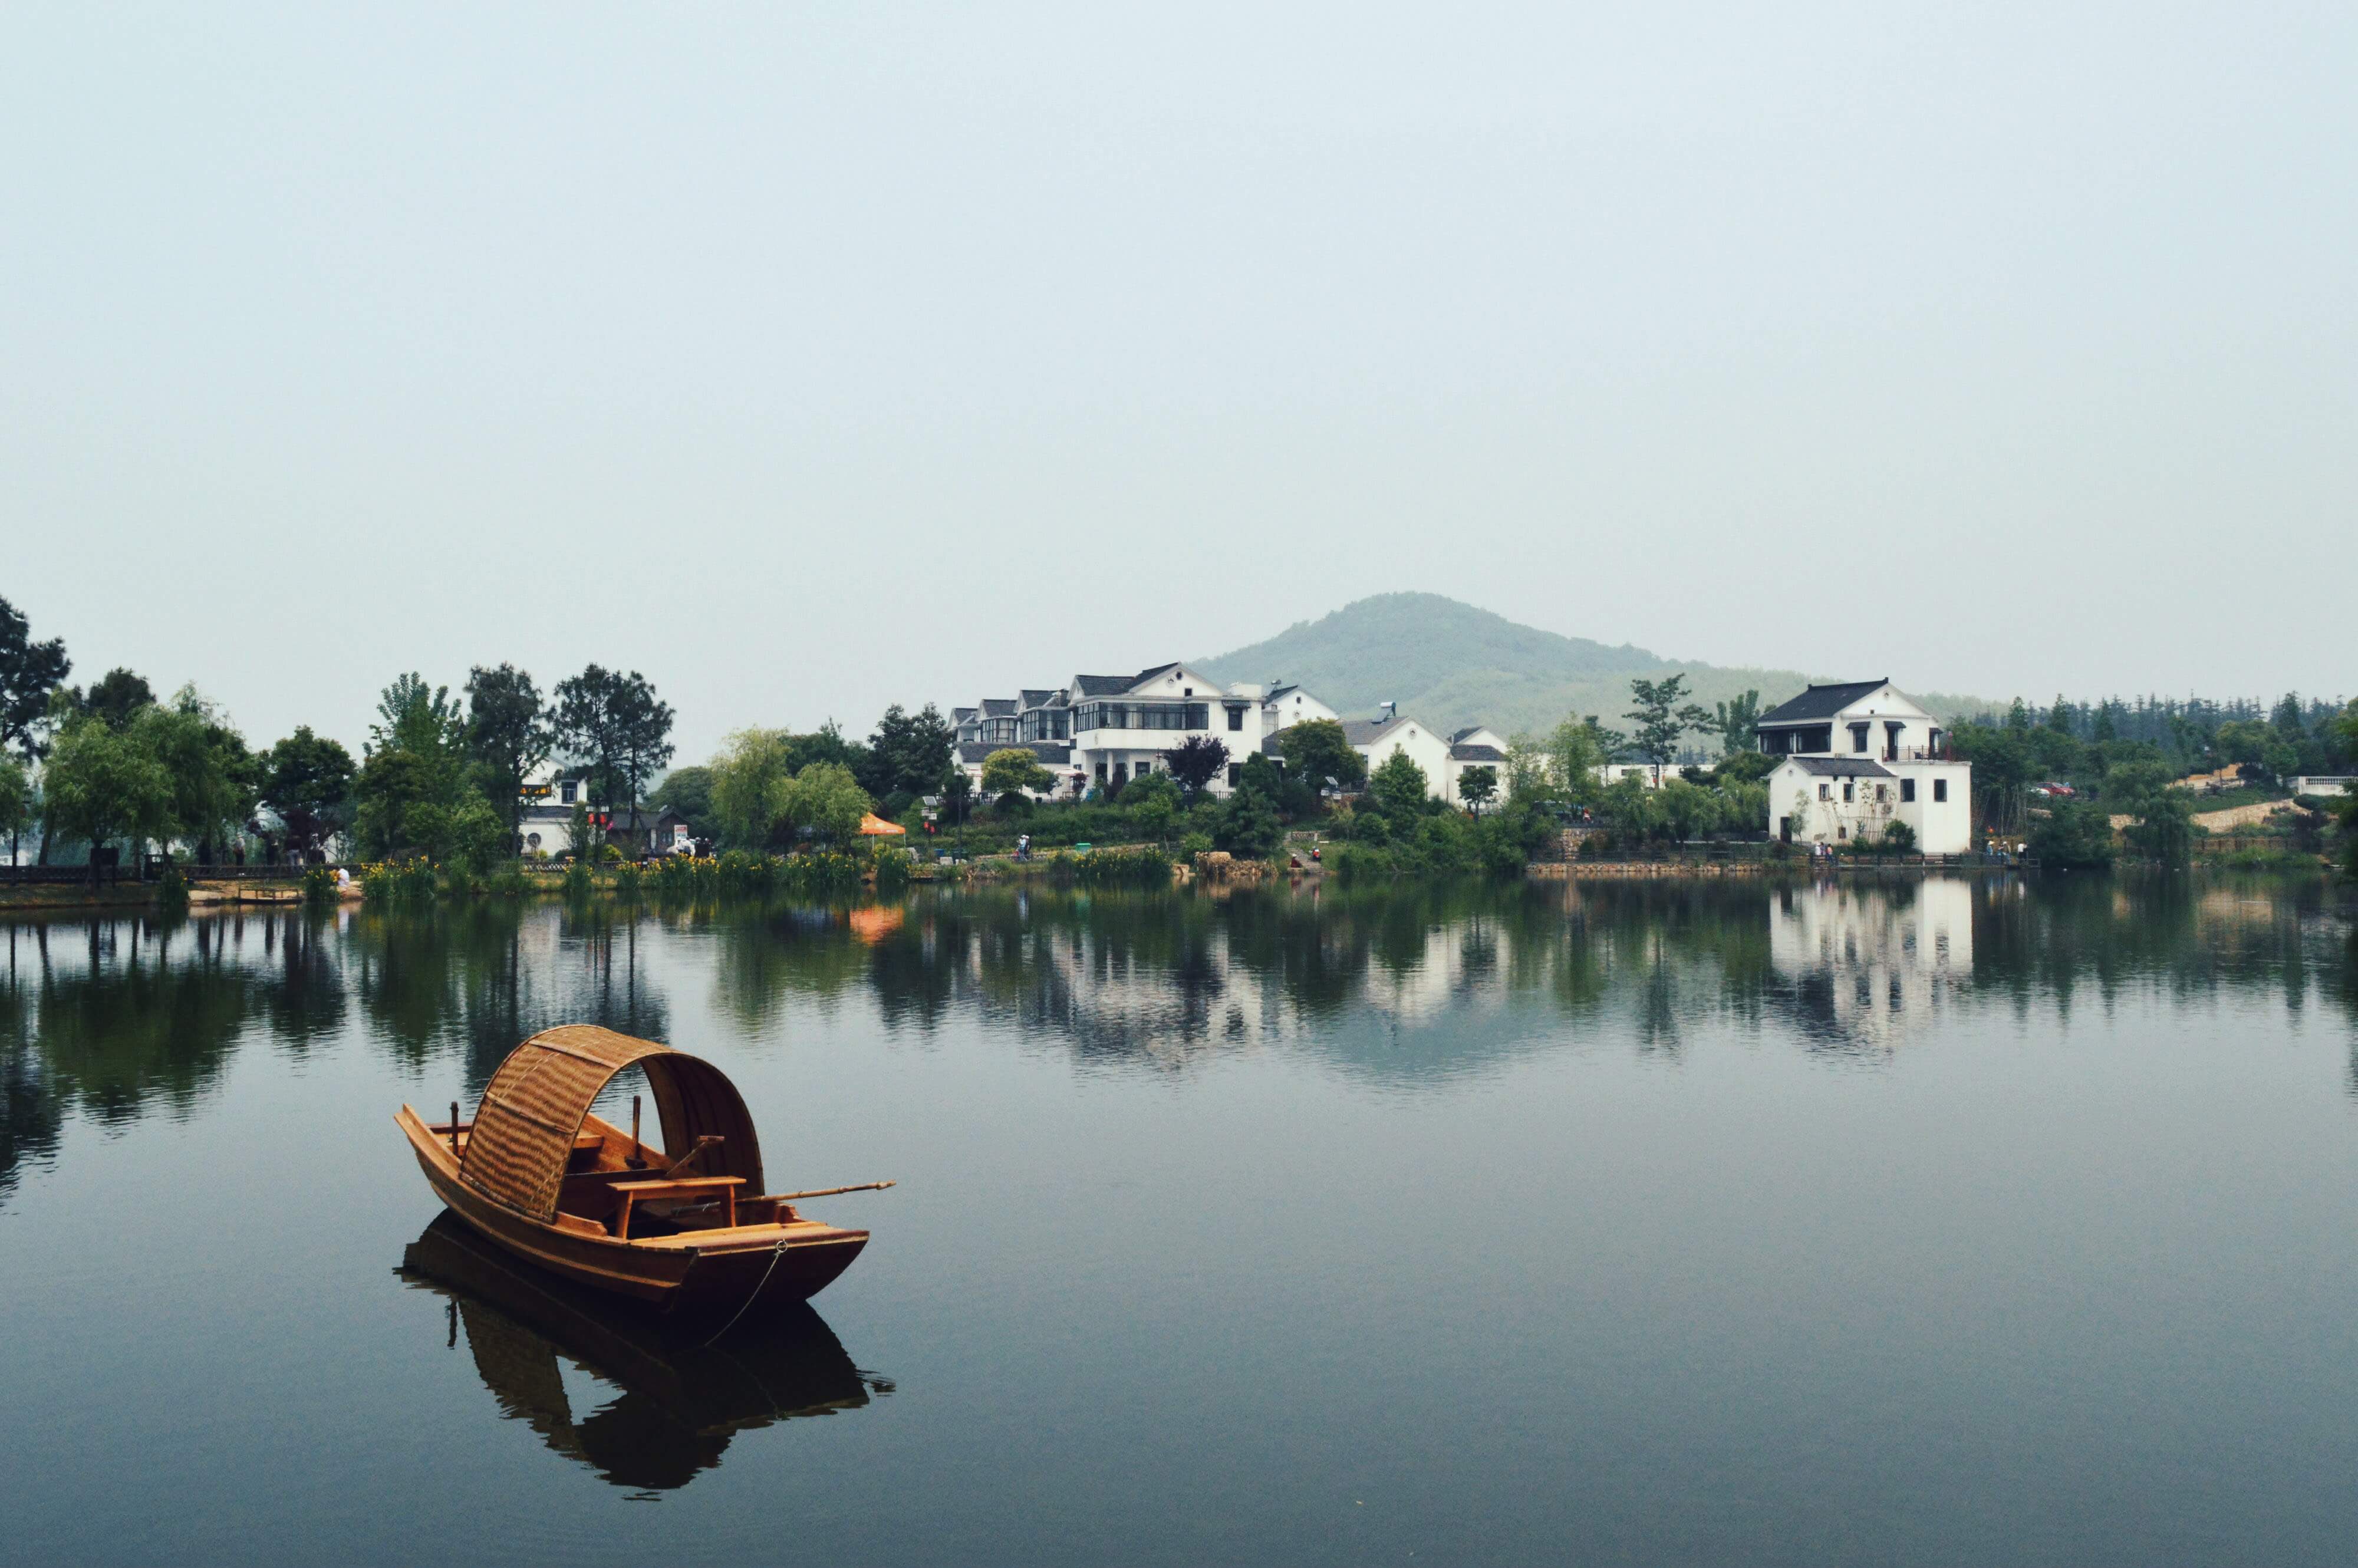
项目要求做一个portal页,作为各个大小屏的入口。一共分为5类,下图是其中的一类。其他的也是类似的布局。
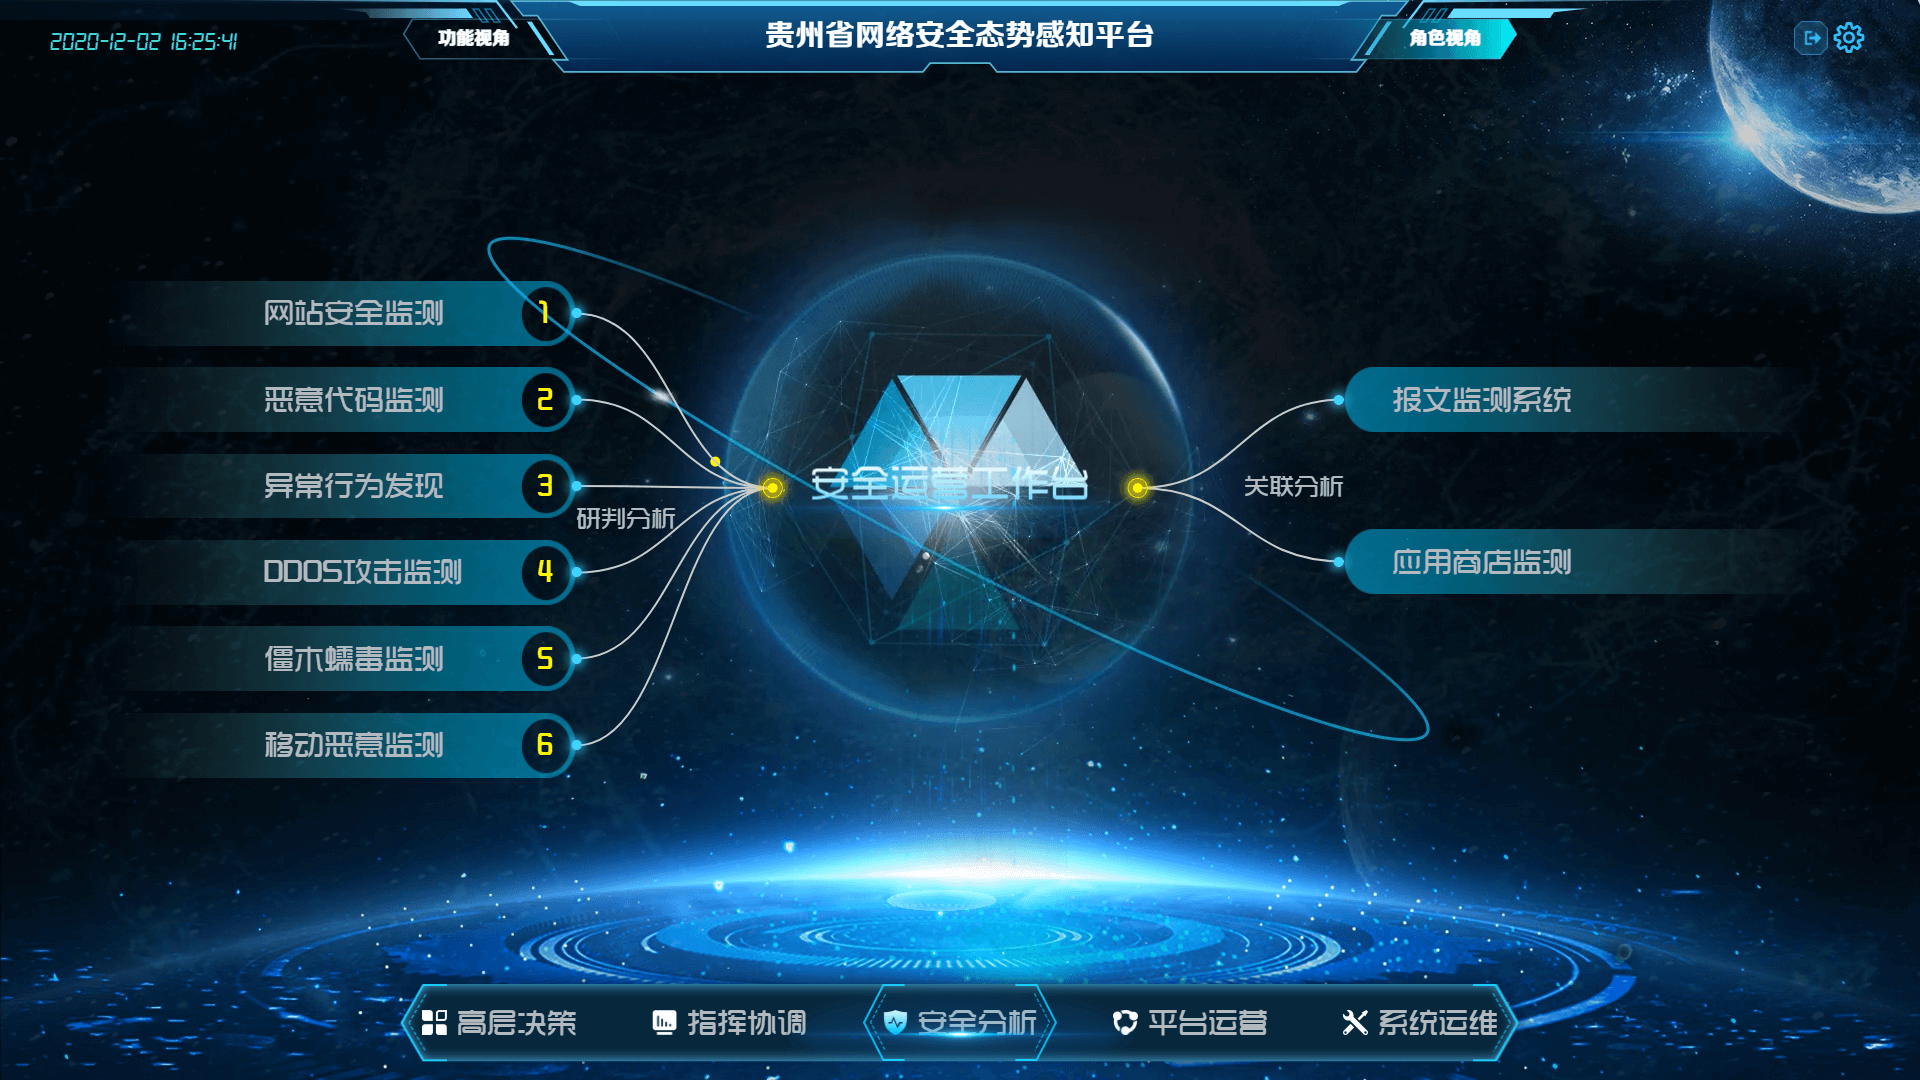
这个咋一看,平平无奇,没啥特殊的。但是有一些问题需要考虑
- 怎么画出来这样的线
- 面对返回的数据不同连线的位置怎么获取及连线
- 线上流动的点怎么做
- 屏幕的尺寸发生变化时,怎么处理画好的线(不能偏)
问题1:怎么画出这样的线
在做预研的时候,考虑可以用两种方案:canvas和svg。最先研究的是canvas,对于这样的曲线觉得应该是要用三阶贝塞尔曲线来画,选好两个控制点,肯定可以画出来。当时也确实画出来啦,至于控制点是怎么算出来的后文会说。画出来之后,还没想怎么加一个在线上一直移动的点,就想着我要怎么把它加到这个页面上,而且页面尺寸变化时线条还要跟着节点位置去变化。于是,我打算放弃canvas,试一下svg。这篇文章也就是记录一下对svg一些学习(都是皮毛)。
svg-path的属性
SVG 的路径<path>功能非常强大,它不仅能创建基本形状,还能创建更多复杂的形状。<path>路径是由一些命令来控制的,每一个命令对应一个字母,并且区分大小写,大写主要表示绝对定位,小写表示相对定位。<path> 通过属性 d 来定义路径, d 是一系列命令的集合,主要有以下几个命令:
| 属性 |
描述 |
M(m) x y |
移动到(x,y)小写表示相对于上个坐标的位移,下同 |
L(l) x y |
画一条线到(x, y) |
H(h) x |
水平画一条直线到x |
V(v) y |
竖直画一条直线到y |
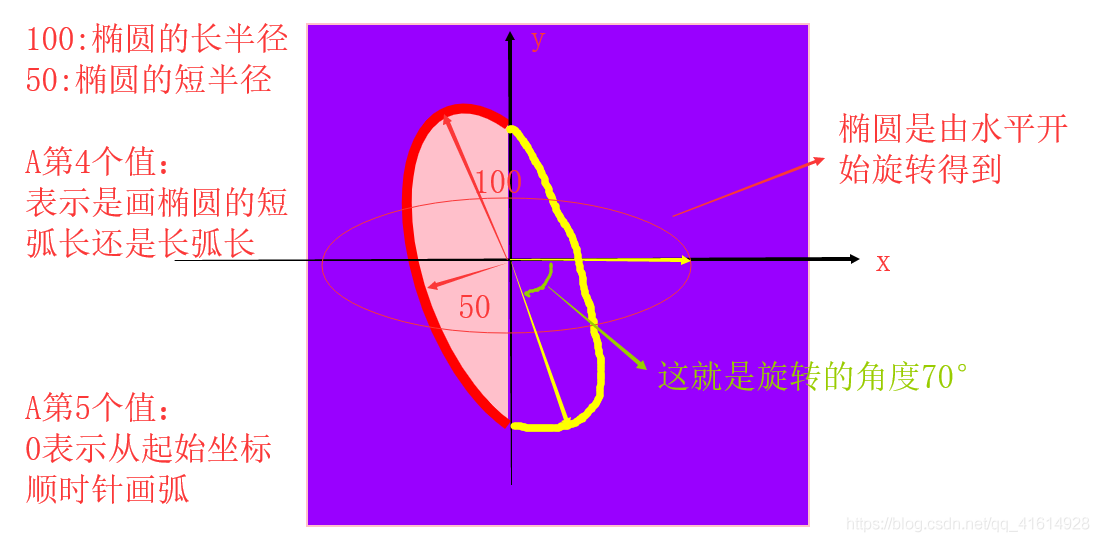
A(a) rx ry x-axis-rotation large-arc sweep x y |
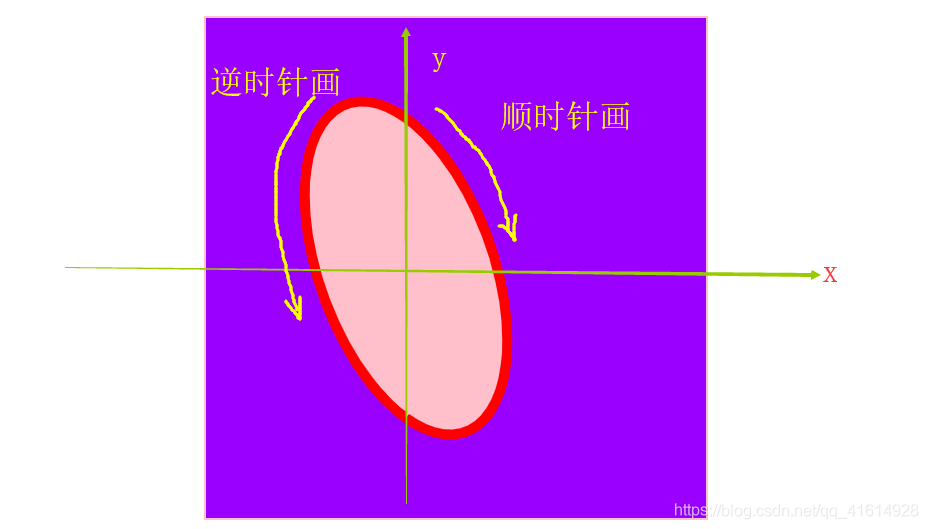
画一段到(x, y)的椭圆弧, 椭圆弧的x, y轴半径分别为rx, ry。椭圆相对于x轴旋转x-axis-rotation度。large-arc=0表明弧线小于180度(小弧), large-arc=1表示弧线大于180度(大弧)。sweep=0表示弧线逆时针画, sweep=1表示弧线顺时针画。 |
Q(q) cx cy xy |
从当前点画一条二阶贝赛曲线,曲线的控制点为(cx, cy)。 |
T(t) x y |
此命令只能跟在一个Q命令使用,假设Q命令生成曲线s,T命令是从s的终点再画一条到(x, y)的二阶贝塞尔曲线。曲线的控制点为s控制点关于s终点的对称点。T命令生成的曲线会比较光滑。 |
C(c) cx1 cy1 cx2 cy2 x y |
从当前点画一条到(x, y)的三阶贝赛尔曲线,曲线的开始控制点和终点控制点分别为(cx1, cy1)和(cx2, cy2)。 |
S(s) cx2 cy2 x y |
此命令只能跟在C命令后使用, 假设C命令生成曲线s, S命令的作用是再画一条到(x, y)的三次贝塞尔曲线, 曲线的终点控制点是(cx2, cy2), 曲线的开始控制点是s的终点控制点关于s终点的对称点。 |
关于如何画椭圆弧:
1
2
3
4
5
6
7
8
| <div id='wrap' style="width: 500px;height: 500px;border: 2px solid pink;margin: 50px auto 0;background-color: #90f;">
<svg xmlns="http://www.w3.org/2000/svg" width='500' height='500' style="stroke: red;stroke-width: 10;fill: pink;">
<path d='M200 100 A100 50 70 0 0 200 400'></path
<path d='M200 100 A100 50 70 1 1 200 400'></path>
</svg>
</div>
|
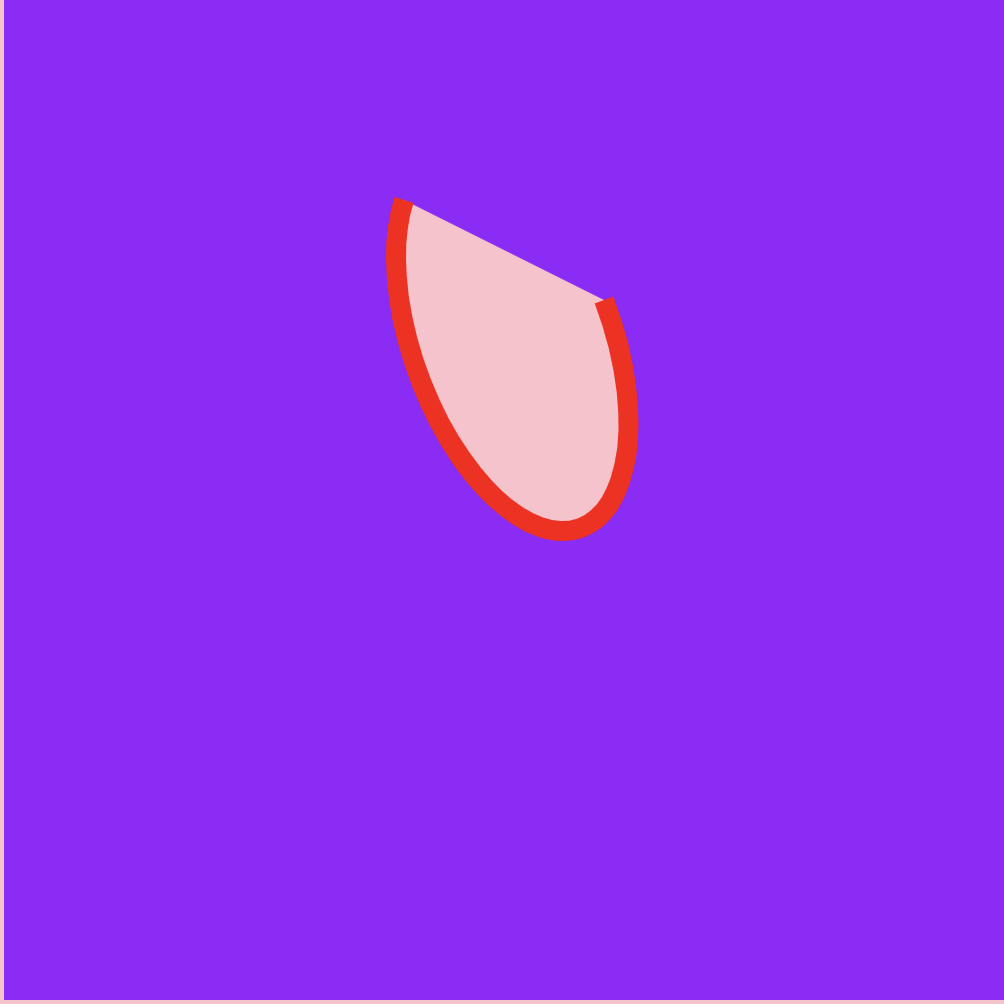
画另外一半:
更加明显的区分大小弧:
1
2
3
4
5
6
| <div id='wrap' style="width: 500px;height: 500px;border: 2px solid pink;margin: 50px auto 0;background-color: #90f;">
<svg xmlns="http://www.w3.org/2000/svg" width='500' height='500' style="stroke: red;stroke-width: 10;fill: pink;">
<path d='M200 100 A100 50 70 0 1 300 150'></path>
<path d='M200 100 A100 50 70 1 0 300 150'></path>
</svg>
</div>
|
小弧:
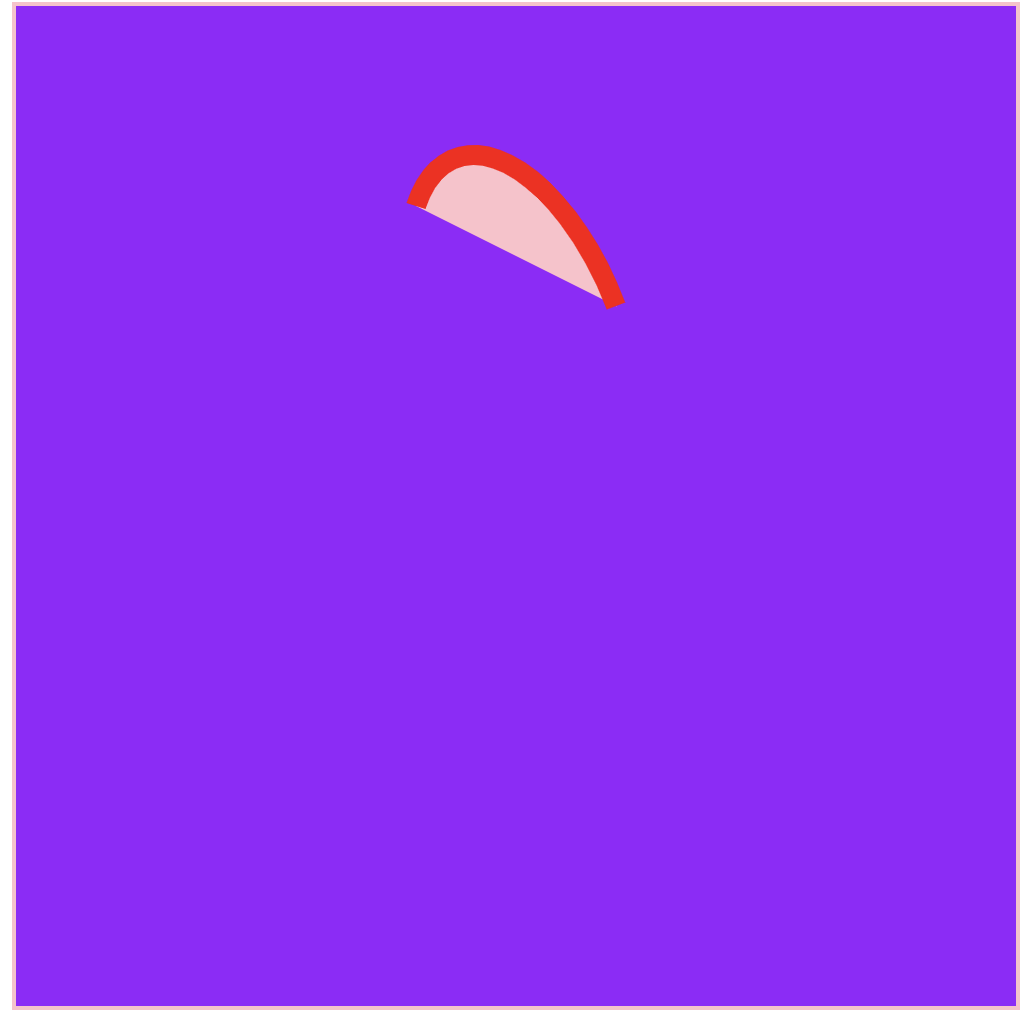
大弧:
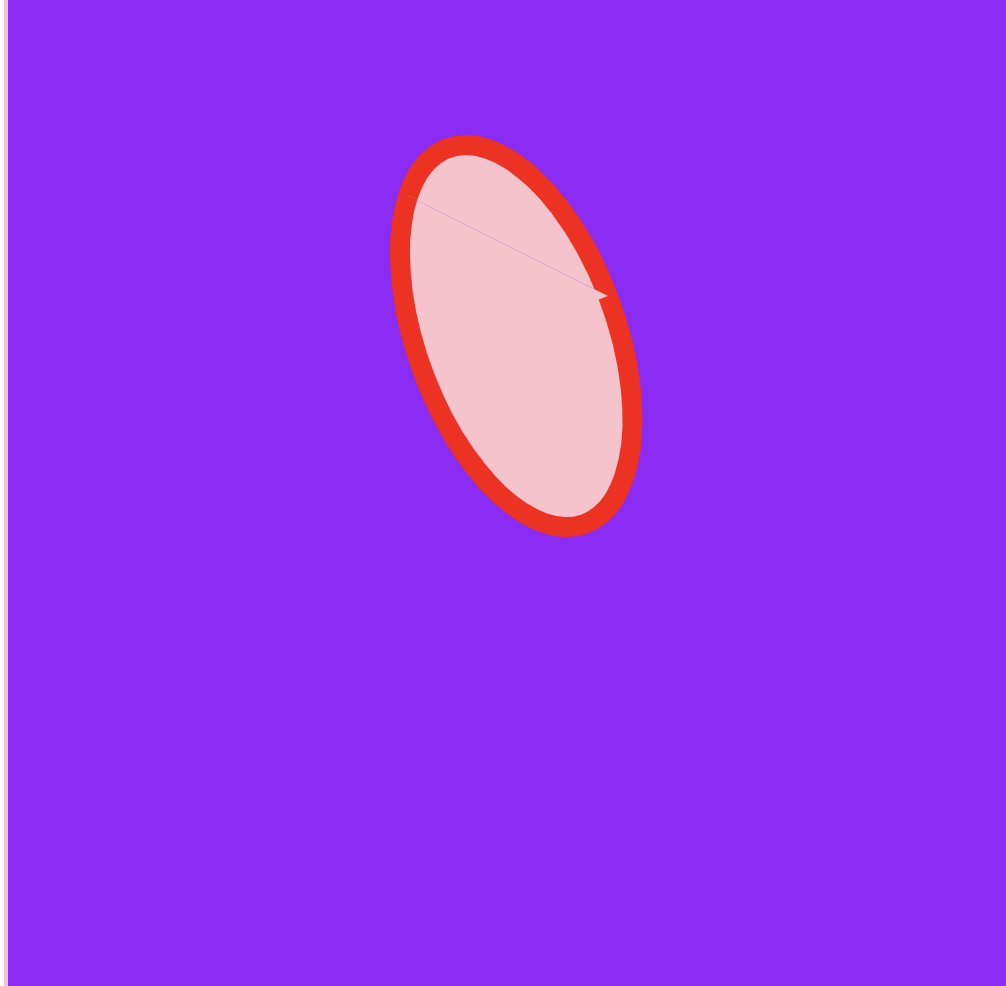
一起画出来:
控制点的选取
关于三阶贝塞尔曲线控制点的选取,是这篇文章给了我灵感。
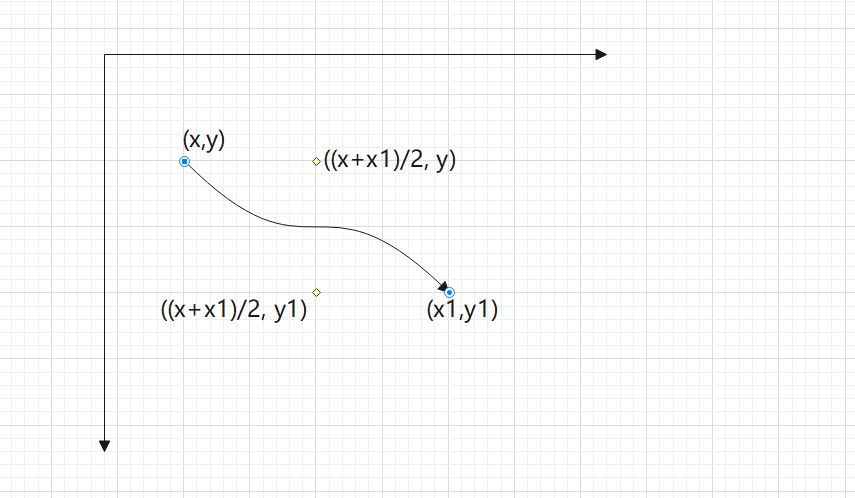
如果起点为(10, 234),终点为(344,341),那么选取两个控制点分别为(177, 234)和(177, 341), 画出的曲线如下图所示。
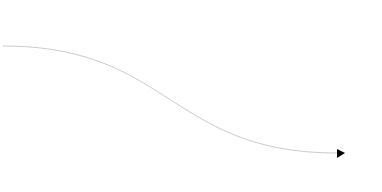
因此可以抽象出:如果起点为(x, y), 终点为(x1, y1),那么两个控制点的可以分别是((x+x1)/2, y)和((x+x1)/2, y1)。
后来的结果验证这个是合理的。
问题2:返回的数据不同连线的位置怎么获取及连线
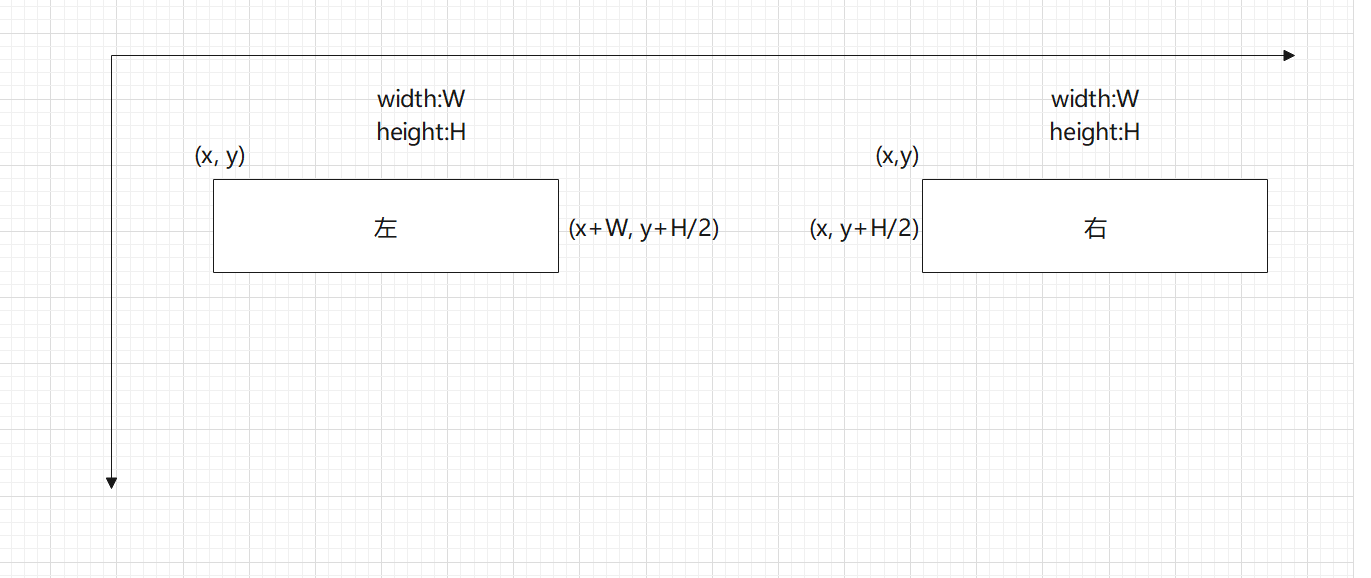
这个图要连线的部分主要集中再左右两部分,当时项目经理说从左往右是由历史到未来,由借鉴到推演。这也就是为啥在左边的DOM类名为history, 右边的DOM类名为future。
SVG的path起于左边DOM->左边黄点(dot_left)->右边黄点(dot_right)->右边DOM
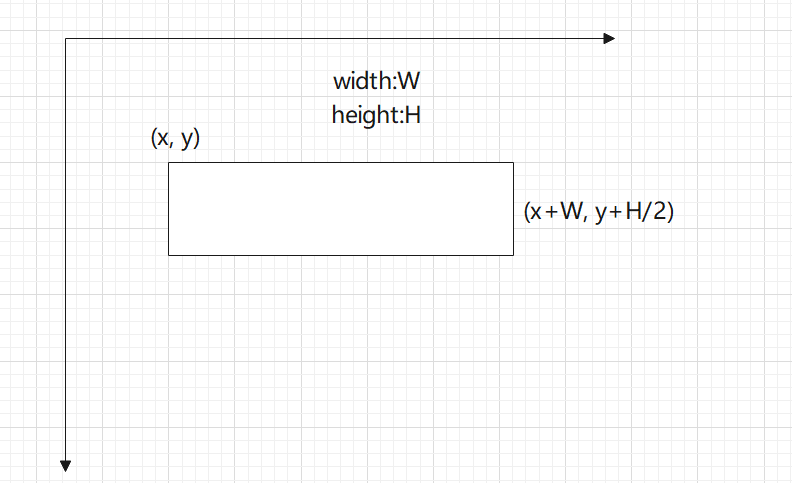
对于左边的DOM来说,SVG起点位置坐标为:
1
2
3
| let block = document.getElementById(id);
let block_left = block.offsetLeft + block.offsetWidth;
let block_top = block.offsetTop + block.offsetHeight / 2;
|
对于右边的DOM来说,SVG终点的坐标为:
1
2
3
| let block = document.getElementById(id);
let block_left = block.offsetLeft;
let block_top = block.offsetTop + block.offsetHeight / 2;
|
同理也可以得到左右黄点的位置:
1
2
3
4
5
|
let dot_left_left = document.getElementsByClassName('dot_left')[0].offsetLeft + 24;
let dot_left_top = document.getElementsByClassName('dot_left')[0].offsetTop + 24;
let dot_right_left = document.getElementsByClassName('dot_right')[0].offsetLeft + 24;
let dot_right_top = document.getElementsByClassName('dot_right')[0].offsetTop + 24;
|
offsetLeft\offsetTop是相对于具有定位元素的父元素来算的。
到这各个点的坐标都获取到。
因此我们只要把容器名(标明SVG元素要append到哪个元素)、左右两边DOM的类名出入下面函数即可。(下面函数中的offset主要是调节控制点的高度,可以对曲线进行微调)
1
2
3
4
5
6
7
8
9
10
11
12
13
14
15
16
17
18
19
20
21
22
23
24
25
26
27
28
29
30
31
32
33
34
35
36
37
38
39
40
41
42
43
44
45
46
47
48
49
50
51
52
53
54
55
56
57
58
59
60
61
62
63
64
65
66
67
68
69
70
71
72
|
methods: {
findAllBlock(containerClassName, classNamehis, classNamefut, offset = 0) {
let domListhis = Array.from(
document.querySelectorAll('.' + classNamehis),
);
let domListfut = Array.from(
document.querySelectorAll('.' + classNamefut),
);
let historyids = [];
let futureids = [];
for (let i = 0; i < domListhis.length; i++) {
historyids.push(domListhis[i].getAttribute('id'));
}
for (let i = 0; i < domListfut.length; i++) {
futureids.push(domListfut[i].getAttribute('id'));
}
this.createSvg(containerClassName, historyids, futureids, offset);
},
createSvg(className, hisIds, futIds, offset) {
let svgDom = document.createElementNS(
'http://www.w3.org/2000/svg',
'svg',
);
let container = document.getElementsByClassName(className)[0];
svgDom.setAttribute('width', '100%');
svgDom.setAttribute('height', '100%');
svgDom.style = `position: absolute;top: 0;left: 0;z-index: -1`;
let path = document.createElementNS('http://www.w3.org/2000/svg', 'path');
let dot_left_left =
document.getElementsByClassName('dot_left')[0].offsetLeft + 24;
let dot_left_top =
document.getElementsByClassName('dot_left')[0].offsetTop + 24;
let dot_right_left =
document.getElementsByClassName('dot_right')[0].offsetLeft + 24;
let dot_right_top =
document.getElementsByClassName('dot_right')[0].offsetTop + 24;
let d = '';
for (let i = 0; i < hisIds.length; i++) {
d += this.getPath_d(hisIds[i], true, dot_left_left, dot_left_top, offset);
}
for (let i = 0; i < futIds.length; i++) {
d +=
' ' +
this.getPath_d(futIds[i], false, dot_right_left, dot_right_top, offset);
}
path.setAttribute('d', d);
path.setAttribute(
'style',
`fill: none; stroke: #ccc; stroke-width: 2px; cursor: default;`,
);
svgDom.appendChild(path);
container.appendChild(svgDom);
},
getPath_d(id, add, dotLeft, dotTop, offset) {
let block = document.getElementById(id);
let block_left = add
? block.offsetLeft + block.offsetWidth
: block.offsetLeft;
let block_top = block.offsetTop + block.offsetHeight / 2;
let control_1_x = (block_left + dotLeft) / 2;
return add
? `M ${block_left},${block_top} C ${control_1_x + offset},${block_top + offset
} ${control_1_x - offset},${dotTop - offset
} ${dotLeft},${dotTop}`
: `M ${dotLeft},${dotTop} C ${control_1_x - offset},${dotTop - offset
} ${control_1_x + offset},${block_top + offset
} ${block_left},${block_top}`;
},
}
|
现在已经把连接线画出来啦。接下来的问题是怎么把在path路径运动的点画出来。
问题3:线上流动的点怎么做
在这参考了 SVG 动画(animate、animateTransform、animateMotion)这篇文章。
<animateMotion>元素让你可以实现一个路径动画,并且根据路径进行旋转。路径使用和<path>相同的方式进行定义。你可以设置属性来定义对象是否根据路径的正切角度来旋转。
例子:线性运动
在这个例子中,一个蓝色的圆在黑盒的左右边缘之间来回的反弹,无限地重复着同样的动作。该动画是由<animateMotion>元素控制的。在这种情况下我们建立了一个路径,由MoveTo命令来创建动画的起始点,然后Horizontal-line命令来将圆向右移动300像素到右边,接着使用Z命令,关闭路径,建立一个环回路径。通过设置repeatCount属性为indefinite,我们可以指定只要SVG图片存在的话,动画是否永久循环。
1
2
3
4
5
6
| <svg xmlns="http://www.w3.org/2000/svg" width="300px" height="100px">
<rect x="0" y="0" width="300" height="100" fill="yellow" stroke-width="1" stroke="red" />
<circle cx="0" cy="50" r="15" fill="blue" stroke="black" stroke-width="1">
<animateMotion path="M 0 0 H 300 Z" dur="3s" repeatCount="indefinite" />
</circle>
</svg>
|
所以我们在上面代码的createSvg方法中添加如下代码:
1
2
3
4
5
6
7
8
9
10
11
12
13
14
15
16
17
18
19
20
21
22
23
24
| path.setAttribute(
'style',
`fill: none; stroke: #ccc; stroke-width: 2px; cursor: default;`,
);
let circle = document.createElementNS(
'http://www.w3.org/2000/svg',
'circle',
);
circle.setAttribute('cx', '0');
circle.setAttribute('cy', '0');
circle.setAttribute('r', '5');
circle.setAttribute('fill', 'yellow');
let animate = document.createElementNS(
'http://www.w3.org/2000/svg',
'animateMotion',
);
animate.setAttribute('path', d);
animate.setAttribute('dur', '10s');
animate.setAttribute('repeatCount', 'indefinite');
circle.appendChild(animate);
svgDom.appendChild(circle);
svgDom.appendChild(path);
|
问题4:屏幕的尺寸发生变化时,怎么处理画好的线
这个问题是偶然发现的,在屏幕尺寸发生变化时,节点的位置发生变化,但是svg化的线没有变,这就导致线和节点的偏差。解决办法就是当屏幕尺寸发生变化时,进行重绘。
1
2
3
4
5
6
7
8
9
10
11
12
13
14
15
16
17
18
19
|
...
mounted() {
this.findAllBlock('safetyAnalysis', 'history', 'future');
},
activated() {
window.onresize = this.redraw;
this.redraw();
},
methods: {
redraw() {
let container = document.getElementsByClassName('safetyAnalysis')[0];
while (container.lastChild.nodeName.toUpperCase() === 'SVG') {
container.removeChild(container.lastChild);
}
this.findAllBlock('safetyAnalysis', 'history', 'future');
}
},
...
|
最后想说的小问题
- 创建svg元素:用document.createElement创建出来的节点是属于html dom,而svg的节点是svg dom。所以需要用createElementNS函数并传入节点名称的命名空间。
let svgDom = document.createElementNS('http://www.w3.org/2000/svg','svg');
1
2
3
4
5
6
7
8
9
10
| <keep-alive>
<component
:is="curCom"
:decisionMaking="decisionMaking"
:commandCoordination="commandCoordination"
:safetyAnalysis="safetyAnalysis"
:platformOperation="platformOperation"
:systemOperation="systemOperation"
></component>
</keep-alive>
|
1
2
3
4
5
6
7
8
9
10
11
12
13
14
15
16
17
| <div
class="history block"
:id="'historyID' + index"
v-for="(item, index) in leftApp"
:key="item"
:style="'top:' + (50 + (index - Math.floor(leftApp.length / 2)) * 8) + '%'"
@click="jumpTo(item.router)"
></div>
<div
class="future block"
:id="'futureID' + index"
v-for="(item, index) in rightApp"
:key="item"
:style="'top:' + (50 + (index - Math.floor(rightApp.length / 2)) * 15) + '%'"
@click="jumpTo(item.router)"
></div>
|
要注意上面DOM元素中的style属性,主要希望这些DOM元素可以均匀合理的分布在中间,既不要整体偏上,也不要偏下。最后的那个乘数主要来控制节点的间距。当某一侧的节点较多时,可以相对地调小一些,反之亦然。
- 水平有限,实现方式或许不是最优解,若有更好的方法,请大佬在评论区告知。
参考文章


.jpg)